Design PDF in MAUI XAML with DrawnUI
Design a PDF report like a MAUI page, with bindings and hot reload, then print it to real A4 pages
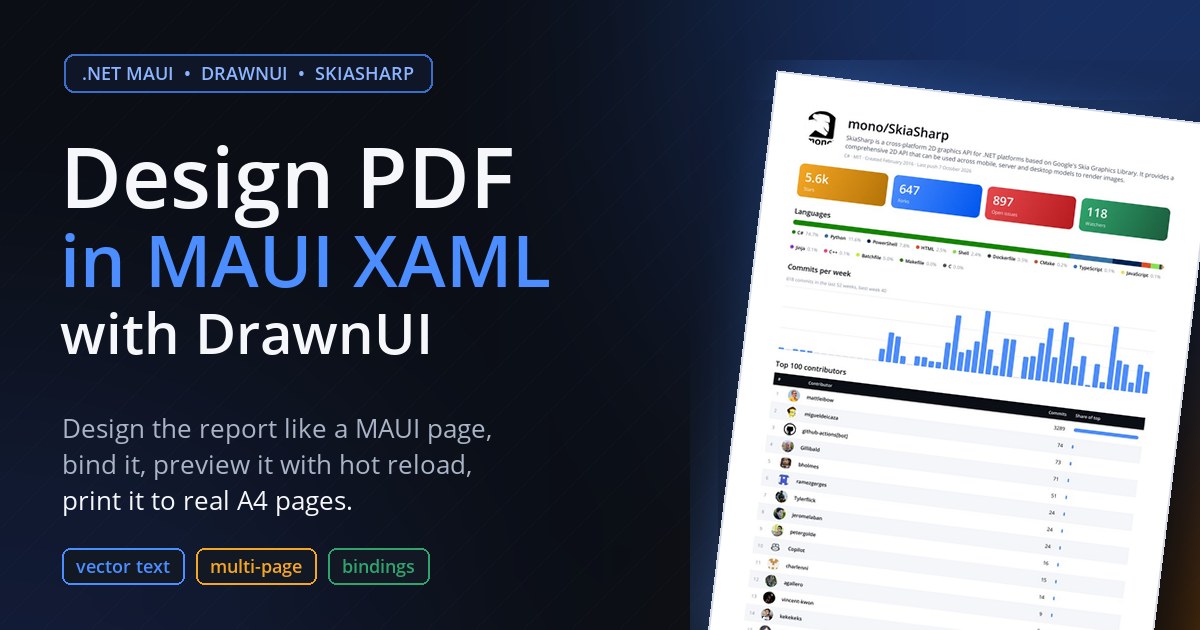
Sometimes a .NET MAUI app has to produce a PDF: a report, a statement, a certificate, something the user can print or send. There are several known ways to do it, and I have my own, which I would like to share with you today: to define the report as a layout inside the app, designed in XAML, populated from a view model, previewed with hot reload, and printed to PDF with SkiaSharp API.
Known ways to make a PDF
This article describes the technique I use, but other ways deserve a mention first.
Gerald Versluis shows the straight road in MauiGeneratePdfSample: a PDF library with a document API, iText in his case, a few lines add a header, a paragraph and an image, a WebView shows the file. For a document made of text and images it is all you need.
A full report engine is the next step, and .NET has a nice one: Pysar by Andrii Kolodiichyk, MIT, on SkiaSharp. You describe the document as bands in its own XAML dialect or a fluent C# builder, pagination and page numbers are part of the model, the output is a vector PDF with a viewer for desktop, mobile and browser. For invoices and statements it is a very good fit, and his article is worth reading on its own.
The Racebox case
My way was born on a production case. Racebox, an auto sport measuring app, had to generate reports from measurement data: a logo, charts, tables and a map with the route drawn on it.
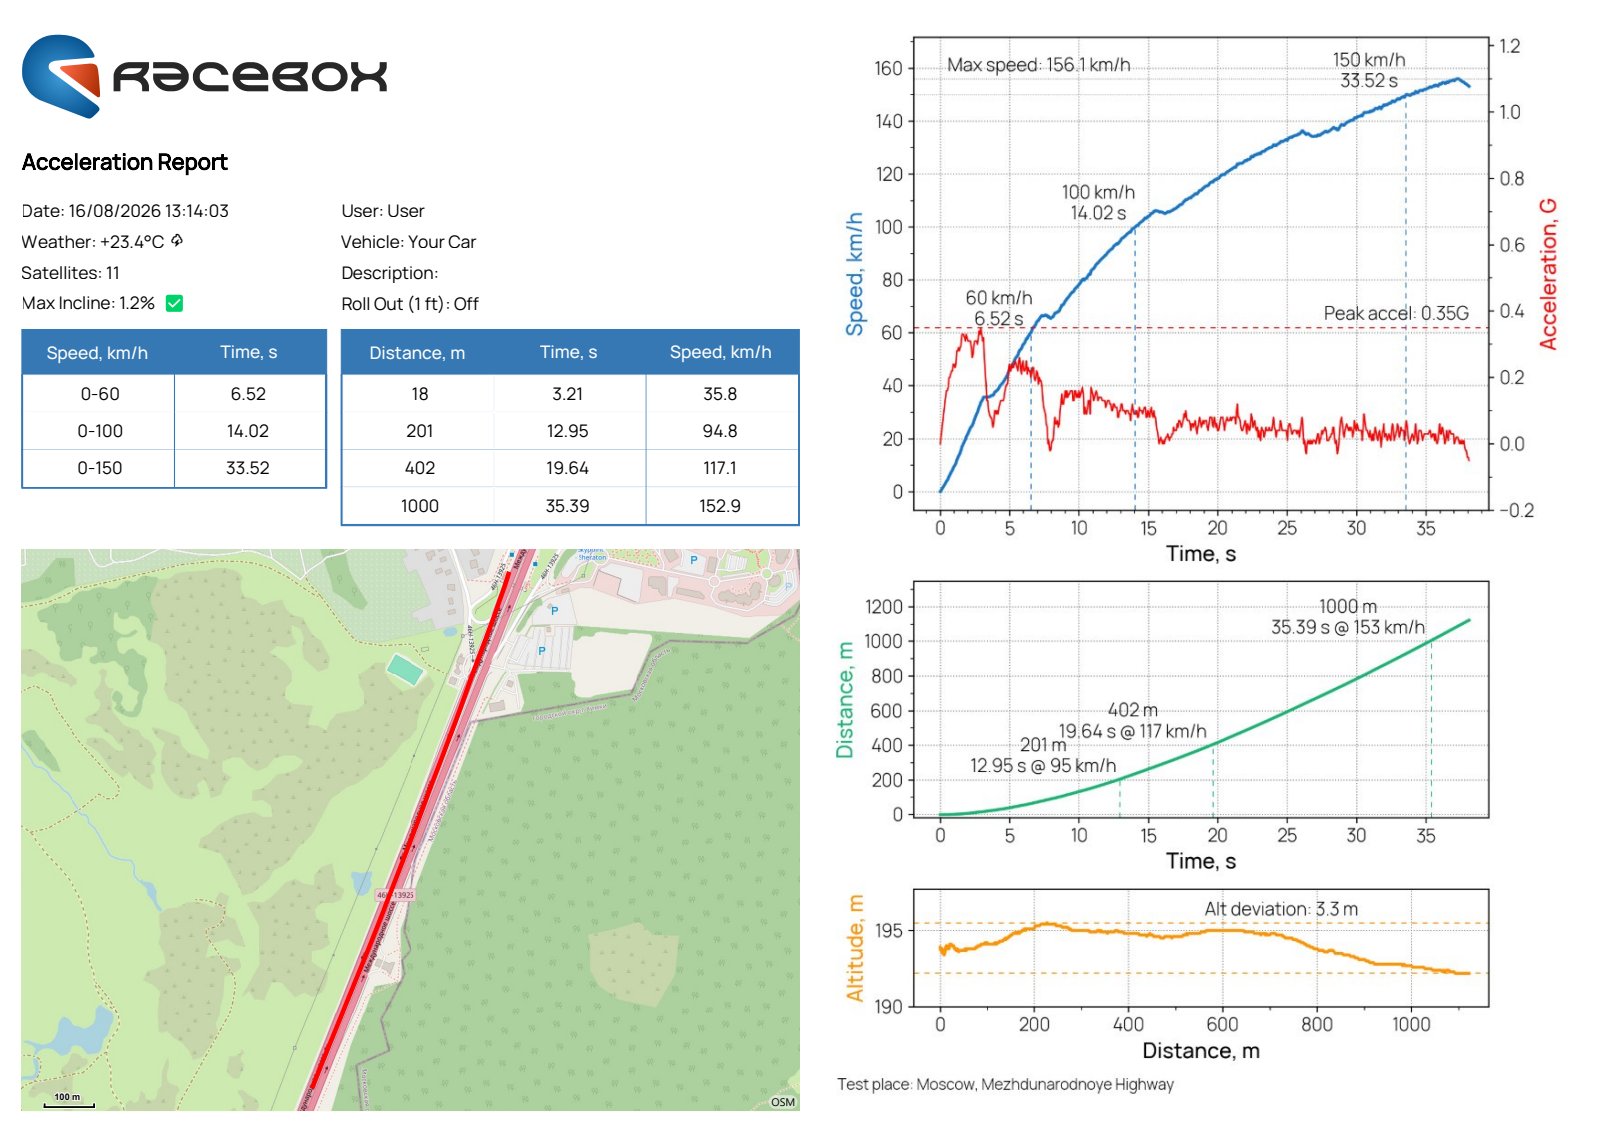
The Racebox report: logo, result tables, the run drawn on the map and three charts. One XAML file with bindings, printed to an A4 landscape PDF.
This app was already using DrawnUI for its screens, rendered with SkiaSharp. So for the PDF I basically needed to render a drawn layout to a virtual paper canvas instead of the screen canvas. The PDF report became just one more drawn layout in a XAML file, filled with the usual MAUI bindings at the moment it is generated, like any MVVM page. A drawn layout does not care where it is drawn, the display, an offscreen bitmap or a PDF canvas, so the same file prints.
What I love about the drawn way: the report reuses the app’s own controls, the map with the route, the charts, the custom-painted parts; one XAML file over the same view model is the screen, the hot reload preview and the printed page; fonts, images and layout are the ones the app already set up.
Nuances of rendering drawn layouts to PDF are pagination, and async content such as remote images or map tiles. Images are loaded by the controls, like on screen, and the report tells us when they have arrived. Below I show it on a sample project you can play with.
The sample app
The sample, RepoReport, is a small MAUI app made for this article.
It will generate a PDF report, fetching its data live from a remote API (GitHub) and filling a report UI defined in XAML via bindings.
The GitHub API gives us the repository data: owner avatar, stars, forks, issues, languages, weekly commits. From it we build the charts and bars with SkiaSharp. The report is defined in XAML and filled with bindings, exactly like a normal MAUI page would be. It may take several A4 pages, split between the elements of the layout rather than through one of them.
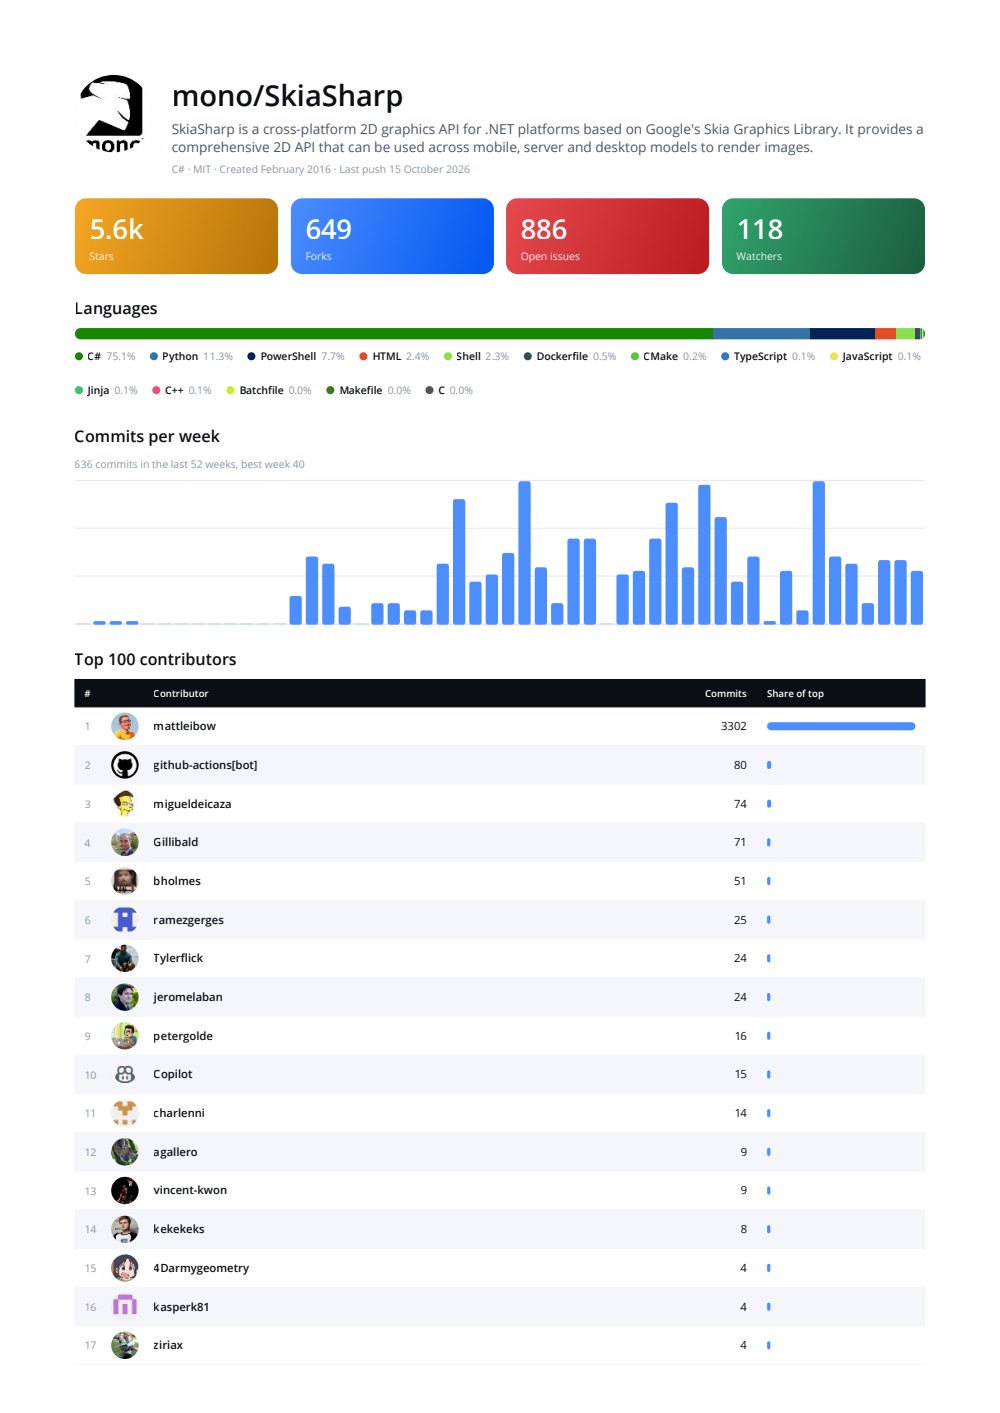
The sample report for mono/SkiaSharp, first page of the PDF: stats, languages, weekly commits and the start of the contributors table.
Type owner/repo (we use SkiaSharp repo by default) and tap Export PDF or Export JPG (Load alone only fetches the data; export will fetch it too when needed): the report is rendered into the file and the same instance is then shown on screen, cached as one image and scaled to fit the screen width, so the data and the images load once. On Windows Preview window opens ReportView.xaml in a second window to edit it with hot reload. No setup and no account needed, the GitHub API answers unauthenticated requests, 60 per hour per address.
This example uses MAUI XAML and the DrawnUi.Maui package. The same report defined in code-behind works where there is no XAML at all: a Blazor app, or a plain .NET server with the DrawnUi.Net package, same controls, same export code. If you would like to see that version covered, tell me in the comments.
About DrawnUI
If you have not used DrawnUI for MAUI before: the DrawnUi.Maui NuGet adds one MAUI view, Canvas, and a set of controls drawn inside it with SkiaSharp. You compose them in the same XAML, with the same bindings and DataTemplates. DrawnUI also works with other frameworks, not only MAUI.
| MAUI | DrawnUI |
|---|---|
Grid, VerticalStackLayout, HorizontalStackLayout, AbsoluteLayout | SkiaLayout with Type="Grid", "Column", "Row", "Absolute" |
Label, Image, Border | SkiaLabel, SkiaImage, SkiaShape |
ScrollView | SkiaScroll |
BindableLayout with ItemsSource and ItemTemplate | SkiaLayout with ItemsSource and ItemTemplate |
| Measure and Arrange done by the layout system | Measure and Arrange you can call yourself |
Two things matter below: drawn controls can cache their pixels with UseCache, and they draw into any Skia canvas, a PDF page included.
DrawnUI ships its knowledge as AI agent skills under docs/skills in the repository. Point your coding agent there for a convenient way of building pixel-perfect drawn UI inside your apps.
Preparing the report
One thing important when creating with XAML: if your report has a long templated table, set this in your project to speed up data template initialization:
1
<MauiXamlInflator>SourceGen</MauiXamlInflator>
In a Debug build MAUI inflates XAML at runtime through reflection, and this can make report generation slow on DEBUG when you have many cells (repo contributors, in our case). That line we added turns the XAML into C# at build time with the .NET 10 XAML source generator.
Our PDF report is a normal DrawnUI layout in a XAML file with code-behind, the root is a Column, because the report should flow down and break into pages:
1
2
3
4
5
6
7
8
<draw:SkiaLayout
    x:Class="RepoReport.Reports.ReportView"
    x:DataType="vm:ReportViewModel"
    Type="Column"
    Padding="48,48,48,40"
    Spacing="28"
    BackgroundColor="White"
    HorizontalOptions="Fill">
- Bindings work as usual, the report gets its
BindingContextat export. - No
UseCacheinside the report: a cached control becomes a bitmap, text stops being text. The page caches the whole instance only after the export, for the screen. - Tables are templated layouts with
RecyclingTemplate="Disabled"andMeasureItemsStrategy="MeasureAll": no viewport, every row must exist. - Sizes are paper units: at 150 dpi a portrait A4 is 1240 by 1753 and
FontSize="19"prints at about 9 points.
Drawn controls do not know where they are to be rendered. On screen the Canvas view measures and arranges them and hands them a Skia canvas. A PDF page is another Skia canvas, so we do the same by hand:
- Choose the paper size.
- Create the report and set its
BindingContext. - Measure and arrange it at the page width, with unlimited height, and let the async content arrive.
- Split it into pages and render every page into the PDF.
- Save the file and share it.
SKDocument from SkiaSharp creates the PDF. DrawnUI has a small Pdf helper with the usual paper formats. The sample prints a portrait A4 at 150 dpi with 0.3 inch margins:
1
2
3
4
5
6
7
8
public const int Dpi = 150;
const float MarginInches = 0.3f;

var scale = 1f;
var inches = Pdf.GetPaperSizeInInches(PaperFormat.A4);
var paper = Pdf.GetPaperSizePixels(inches, Dpi);
var margins = MarginInches * Dpi;
var pageInner = new SKSize(paper.Width - margins * 2, paper.Height - margins * 2);
Rendering
The page creates the report like any control, new ReportView { BindingContext = data }, and hands it to the exporter: never attached to a Canvas, measured with the page width and unlimited height, arranged, with scale = 1 since our units are pixels. Then we render, more than once.
We need several rendering passes for cases when some data loads into our report in an async manner. Think of this as an app UI updating several times, after it gets some data from API, some images load from URLs and so on.
The first Render starts the async loads. The report says when it is complete through IContentReadyAware { bool ContentIsLoaded { get; } }. The sample answers from state, not events: every SkiaImage in its tree has loaded, failed or stopped loading, and all images the view model asked for exist. A missed event would hold the export until its timeout. Racebox listens to the map LoadingChanged event instead.
A PDF canvas keeps every drawing command, so the warm-up passes go into an SKPictureRecorder and the picture is thrown away: render, wait for ContentIsLoaded with a timeout, render again, repeat while NeedUpdate is set, with a cap. On screen the Canvas does that loop for us, here we are the Canvas.
Pages
After the warm-up every layout’s RenderTree holds the rectangles its children were drawn into. Pdf.SplitStackToPages reads the templated Column of the table and returns page offsets that break between rows, so a row is never cut in two:
1
var pages = Pdf.SplitStackToPages(content, isTemplated: true, pageInner, scale);
The content is wrapped in a SkiaLayout with Padding for the margins and a SkiaScroll inside, arranged at the paper size. For every page we move the scroll offset, clip the canvas to the page’s Height (the viewport is a full paper tall, the split is not) and render the wrapper into SKDocument.BeginPage. One thing to know: BeginPage takes points, 72 per inch, not our pixels, so the sample opens the page in points and scales the canvas by 72 divided by the dpi. The PDF comes out as a real A4, text and shapes stay vectors.
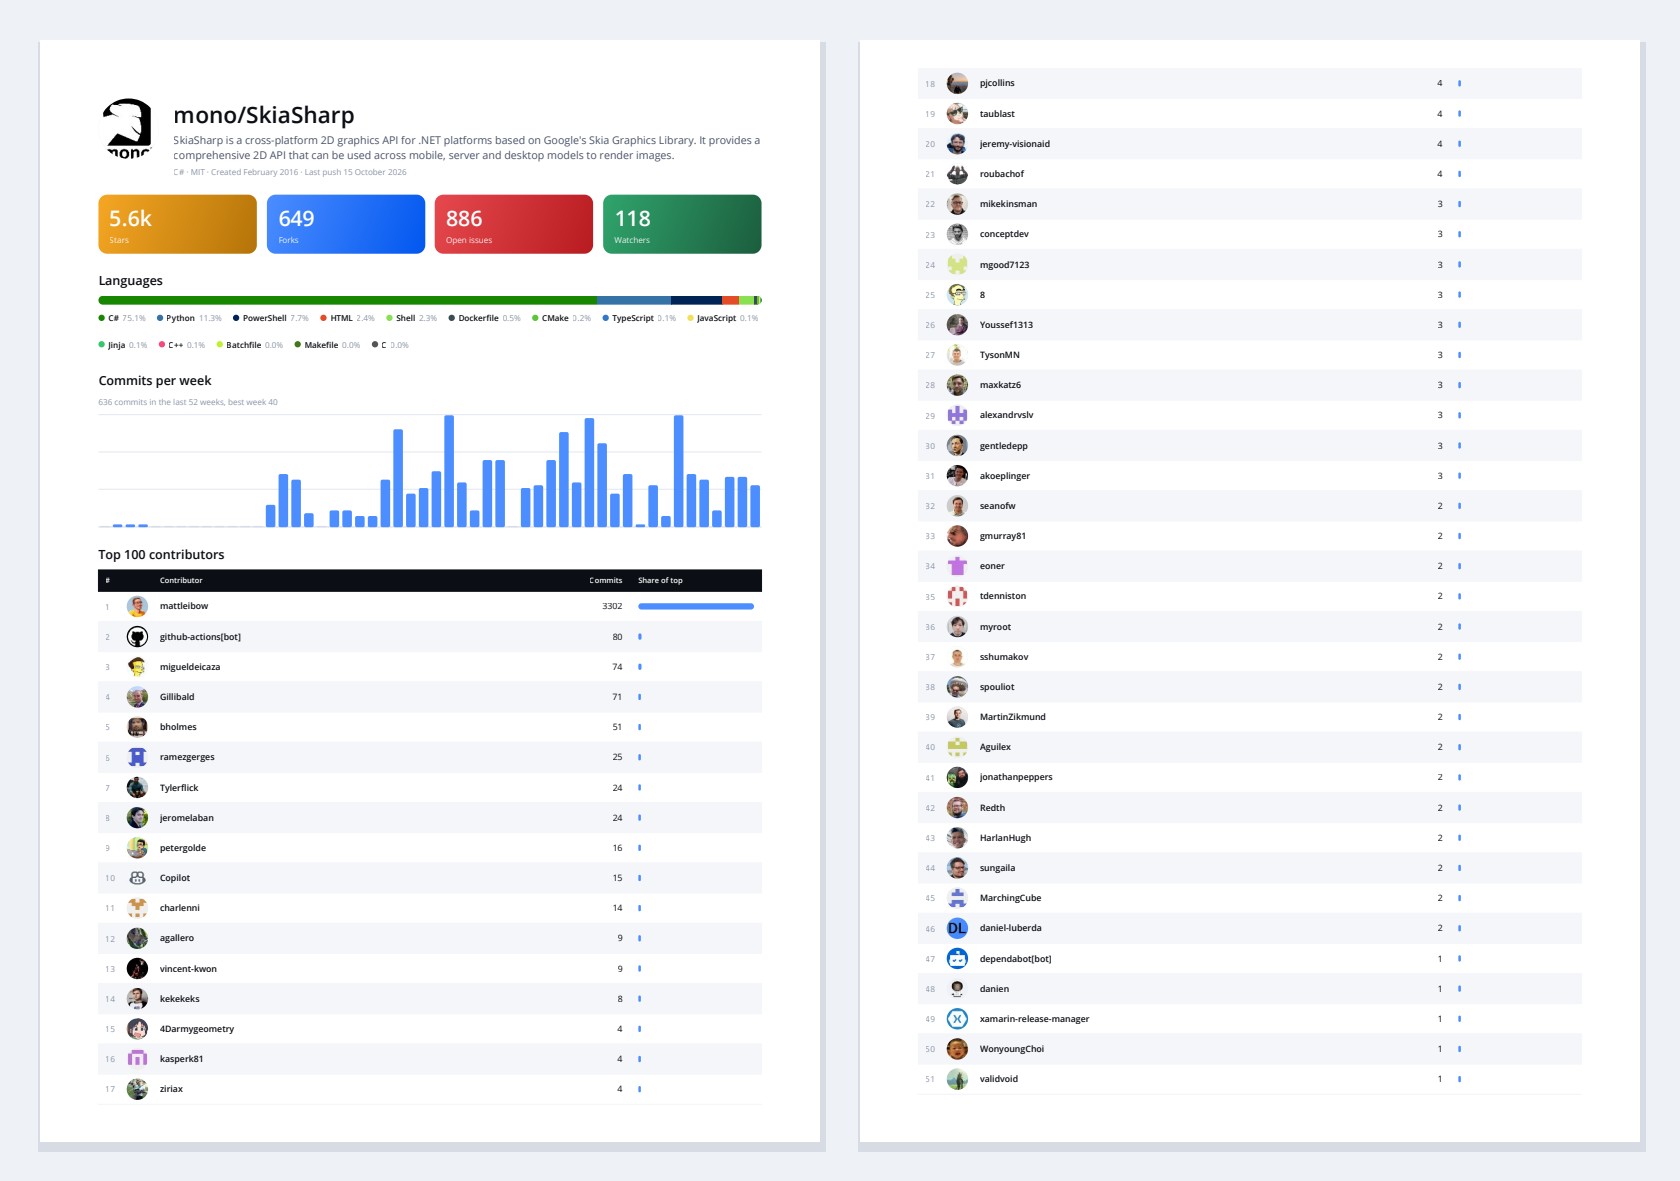
Pages 1 and 2 of the export: the table breaks after row 17, row 18 starts the next page whole.
Summarizing
A PDF report is a layout like any other: define it in XAML, bind it to a view model, preview it with hot reload. The export is done by hand: measure at the page width, warm up until the async content is in, split between rows, render every page into SKDocument in points. Text and shapes stay vectors, and the same file serves the screen and the paper.
Headers and footers would be a small layout rendered over every page before EndPage; landscape or Letter is a different PaperFormat, nothing else changes. What would you print from your app? If something is missing in the Pdf helper, issues and PRs are welcome.
Links and Resources
- RepoReport, the sample from this article
- DrawnUI Docs, start with Getting started if the
draw:namespace is new to you, and the DrawnUI Repo - SkiaSharp - the 2D graphics library this all runs on
- MauiGeneratePdfSample by Gerald Versluis, with a video
- Pysar, the .NET report engine
The author is available for consulting and development of cross-platform apps and custom controls. If you need help creating pixel-perfect custom UIs, or apps from scratch, feel free to reach out.